

Data Visualization is a critical component of effective business communication. Learn to get it right by mastering just a few simple principles.
Links mentioned in this video:
Exercise File ► https://www.theanalystacademy.com/wp-content/uploads/2023/05/Crash-Course-Exercise.pptx
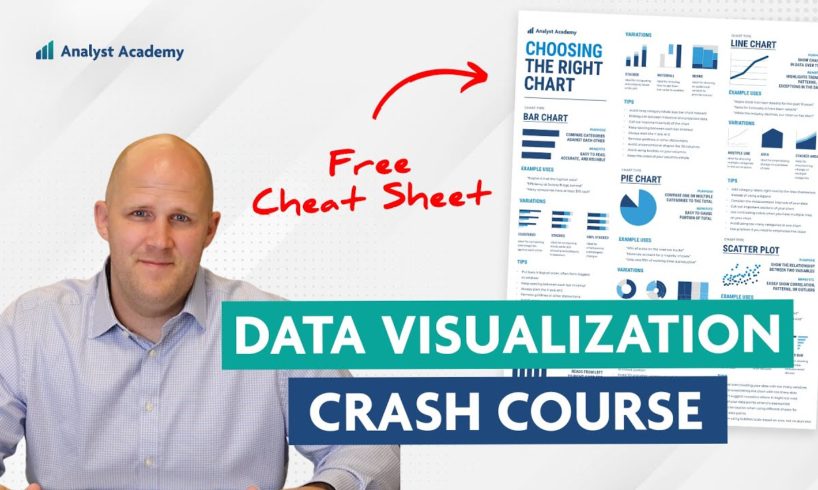
Charts PDF ► https://www.theanalystacademy.com/charts/
Full Course ► https://www.theanalystacademy.com/data-visualization-for-consultants/
Courses for Teams: ► https://www.theanalystacademy.com/teams/
Ampler Charts ☞ https://my.ampler.io/alumni/theanalystacademy
*Affiliate link
Other YouTube Videos mentioned:
Economist Charts ► https://youtu.be/cGGkAGBre3A
Redesigning Beautiful Charts ► https://youtu.be/MuSSeIE3Og8
Fixing Data-Heavy Slides ► https://youtu.be/zZ4dmIMlHvI
=============================================
🚀 FOLLOW US
We regularly post high-quality content (that’s actually helpful)
☞ Instagram: https://www.instagram.com/theanalystacademy/
☞ Linkedin: https://www.linkedin.com/company/the-analyst-academy-llc/
☞ YouTube: https://www.youtube.com/channel/UCr7EYWaQzs2nsZUN_9_ydSQ
🏆 COURSES
Join thousands of people all around the world who have enrolled in our courses
☞ FREE Slide-Building Course: https://www.theanalystacademy.com/free-email-course/
☞ Data Visualization Course:
☞ Advanced Presentations Course: https://www.theanalystacademy.com/advanced-presentations-for-consultants/
☞ Advanced PowerPoint Course: https://www.theanalystacademy.com/advanced-powerpoint-for-consultants/
☞ Courses for Teams: https://www.theanalystacademy.com/teams/
📣 DOWNLOADS
Use our most popular downloads to improve your slide-making skills
☞ Top 50 PowerPoint Shortcuts (PDF): https://www.theanalystacademy.com/top-50-powerpoint-shortcuts/
☞ Choosing the Right Chart Cheat Sheet (PDF): https://www.theanalystacademy.com/charts/
☞ 100+ Real Consulting Presentations: https://www.theanalystacademy.com/consulting-presentations/
🎬 MORE POPULAR VIDEOS
Check out some of our latest and greatest here on YouTube
☞ PowerPoint Storytelling: https://youtu.be/C-cJj9S4e2c
☞ Redesigning McKinsey Slides: https://youtu.be/5zw5HWXGFAE
☞ Fixing Data-Heavy Slides: https://youtu.be/zZ4dmIMlHvI
☞ Top 8 PowerPoint Hacks for Consultants: https://youtu.be/-Ab-HYN0WUo
☞ Consultant Explains the Pyramid Principle: https://youtu.be/elMPIxLYtoc
☞ How to Design Effective Presentations: https://youtu.be/4TQC83nGv4Y
ABOUT US
At Analyst Academy, we teach high-value consulting skills found at the world’s top consulting firms. Our clients include small businesses, Fortune 500 companies, universities, and individual students in 100+ countries around the world. Each of our courses combine years of knowledge from high-performing consultants into highly engaging lessons packed full of best practices, time-saving tricks, and some of the industry’s best kept secrets. Our downloads, courses, and articles are all inspired by best practices from the consulting industry. Learn more at https://www.theanalystacademy.com
All views expressed on this channel are that of The Analyst Academy LLC and its employees. Any materials mentioned or shown have been obtained through publicly available sources (e.g. firm or client website).
#powerpoint #presentations #consulting
source


Thanks for watching! Get the Cheat Sheet PDF here 👉 https://www.theanalystacademy.com/charts/
Thank you so much 👍👍👍
3:50 As a scientifically oriented person, I would never chose this chart because it is wrong. But I think sometimes you shouldn't care about the correctness but rather if it makes something clear. And using this chart type is honestly the only way. Putting dots on the line could satisfy both parts if my brain probably.
And someone at 9:31 intruduced rounding errors. They should have gone with a different colour palette to emphasize the 63/62% this way and not using the addition of the rounded values as the indicator for the 63 split.
i’m a surgery resident and i still love watching these for my research presentations
🎩
Can you make also video’s for management consultant? Your slides are perfect, but rather for strategy consultants. My life is more about how we implement or how we proceed
Great topic and effectively delivered sir! Keep up the great content
My main question is when do you and don’t you want to show numerical scales on a graph. For example, on a bar graph, when would you show the x-axis numerical scale and when would you leave it off? You already have labels showing the number value for each bar so when is the x-axis scale being shown important, and when is it redundant?
Really good video, thanks a lot!
You are one of the best on youtube. It would be nice if you can do more videos on data visualization tools like Tableu or PowerBI.
Is it possible to get hundred percent scholarship/promo code for deserving/underprivileged people?
Looks like there is a positive correlation between High Quality Content and Revenue Growth
Awesome video. Thank you!